The Turtle and the Fern
Plotting fractal ferns using Turtle graphics in Python.
A few months ago I made a post on plotting fractals using Turtle. Another product of those explorations was some decent plots of fractal ferns. I implemented the algorithm for plotting the Barnsley fern, and then generalised it so that parameters could be changed in order to plot other ferns.
The Fern Plotting Function
The python code for the generalised function used to plot the fern is shown below:
1
2
3
4
5
6
7
8
9
10
11
12
13
14
15
16
17
18
19
20
21
22
23
24
25
26
27

def draw_fractal_fern(a, b, c, d, e, f, p, max_interations, pen,
                      scale_x, scale_y, offset_x, offset_y):
    x, y = 0, 0
    xn, yn = 0, 0

    for n in range(max_interations):
        pen.goto( scale_x * xn - offset_x, scale_y * yn - offset_y)
        pen.pendown()
        pen.dot(3)
        pen.penup()
        r = random.random()
        if r < p[0]:
            xn =  a[0] * x + b[0] * y + e[0]
            yn =  c[0] * x + d[0] * y + f[0]
        elif r < p[0] + p[1]:
            xn =  a[1] * x + b[1] * y + e[1]
            yn =  c[1] * x + d[1] * y + f[1]
        elif r < p[0]+ p[1] + p[2]:
            xn =  a[2] * x + b[2] * y + e[2]
            yn =  c[2] * x + d[2] * y + f[2]
        else:
            xn =  a[3] * x + b[3] * y + e[3]
            yn =  c[3] * x + d[3] * y + f[3]
        x = xn
        y = yn
The Plotting Function Explained
In order to fully understand the plotting function it is necessary to have a basic understanding of the mathematical theory which governs the fern plot. The plots are based on four affine transformations which are obtained from the formula:
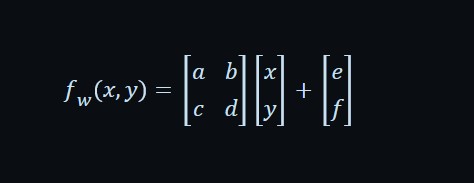
By substituting values for a, b, c, d, e, and f into the formula, it is is possible to obtain 4 transformations which can be used iteratively in conjunction with a probability factor p to produce the fern. A sample table of values which can be used to generate a fern is shown below:
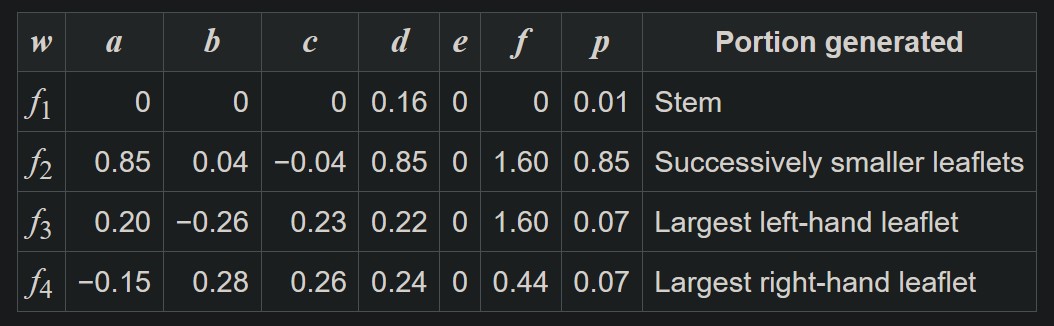 Matrix of values for generating the Black Spleenwort fern (Source: Barnsley Fern)
Each row of the table shows the values used in the formula for each transformation along with the probability factor used to determine which transform equation to use during point generation. With these details we have the basics needed to understand the draw_fractal_fern function.
The first 7 parameters, a through p, are arrays containing the values for each affine transformation and its paired probabilty factor. The max_iterations parameter is the the maximum number of iterations, as the name suggests, and it is used to control the level of detail. The plots below show the Barnsley fern plotted using 10 000 and 100 000 max iterations respectively. The difference in the level of detail is quite stark.
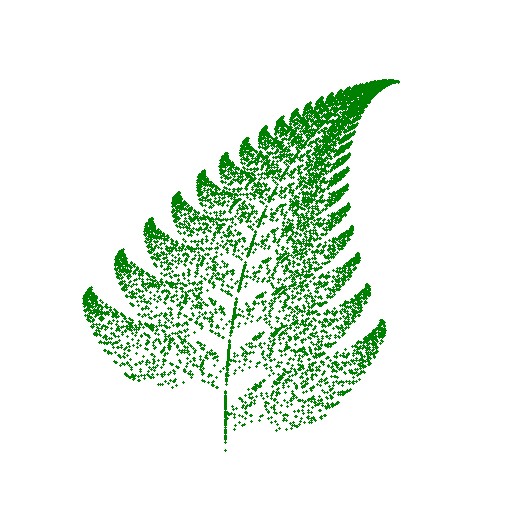 Barnsley Fern - 10K iterations
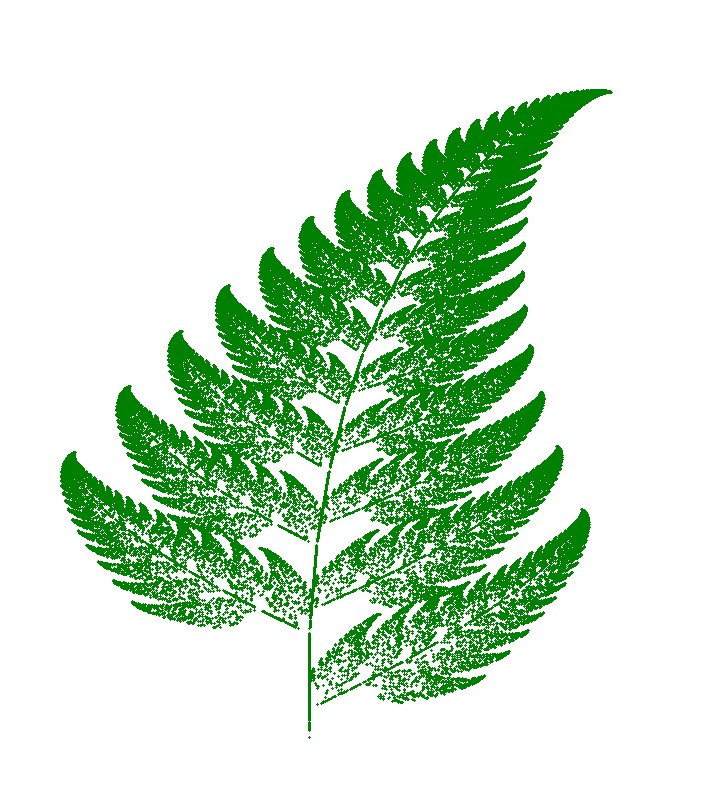 Barnsley Fern - 100K iterations
As demonstrated by the previous images, the higher the number of iterations, the more defined the image will be, though increasing the value beyond a certain point adds nothing to the image quality.
The last 4 parameters are scale and offset parameters which are used to position and size the fractal within the window. The sample code below shows how the draw_fractal_fern function can be used to generate a plot of the Barnsley fern.
1
2
3
4
5
6
7
8
9
10
11
12
13
14
15
16
17
18
19
20
21
22
23
24
25
26
27
28
29
30
31
32
33
34
35
36
37
38
39
40
41
42
## Barnsley fern parameters
fern_name = "Barnsley"

a = [0.0, 0.85, 0.20, -0.15]
b = [0.0, 0.04, -0.26, 0.28]
c = [0.0, -0.04, 0.23, 0.26]
d = [0.16, 0.85, 0.22, 0.24]
e = [0.0, 0.0, 0.0, 0.0]
f = [0.0, 1.60, 1.60, 0.44]
p = [0.01, 0.85, 0.07, 0.07]

## Offsets for positioning Barnsley fern
offset_x = 25
offset_y = 190
##

## scale parameters for fitting fern inside the window
scale_x = 65
scale_y = 37
scalefactor = 2

fscale_x = scale_x * scalefactor
fscale_y = scale_y * scalefactor
foffset_x = offset_x * scalefactor
foffset_y = offset_y * scalefactor

## change this to increase or decrease level of detail
max_interations = 10000

screen = turtle.Screen()
screen.tracer(0)

pen = turtle.Turtle()
pen.hideturtle()
pen.speed(0)
pen.color("orange")
pen.penup()

draw_fractal_fern(a, b, c, d, e, f, p, max_interations,pen, fscale_x, fscale_y, foffset_x, foffset_y)
screen.update()

screen.mainloop()
The entirety of the code can be found here in the TurtleFractals Github repo. It includes parameter values for plotting the modified Barnsley, Culcita, and Cyclosorus ferns.
Some Sample Fern Plots
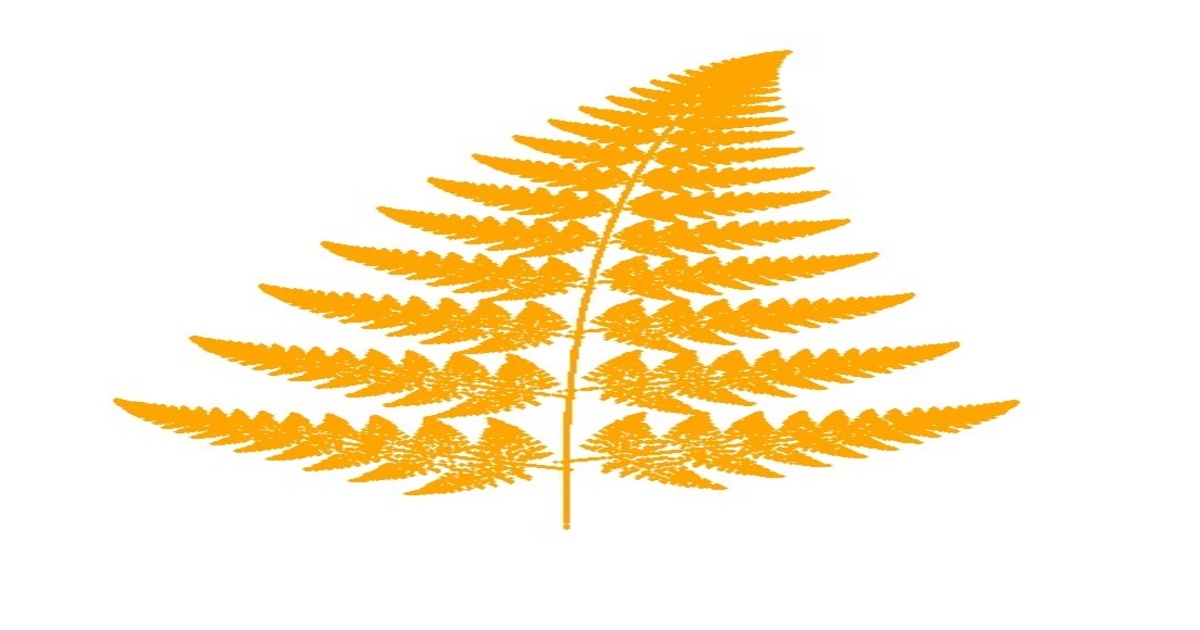
The images which follow were generated using the code with max iterations set to 100 000. I found that I liked the artisanal feel of the images produced at this limit. I stuck to the more natural colours of green and orange yellow for the ferns. (Though if I’m honest I’m not sure if ferns turn this colour during the fall.)
Modified Barnsley Fern
This modified Barnsley fern plot was my favourite of the lot. It made me think of fall and all of its vibrant yellow and red colours.
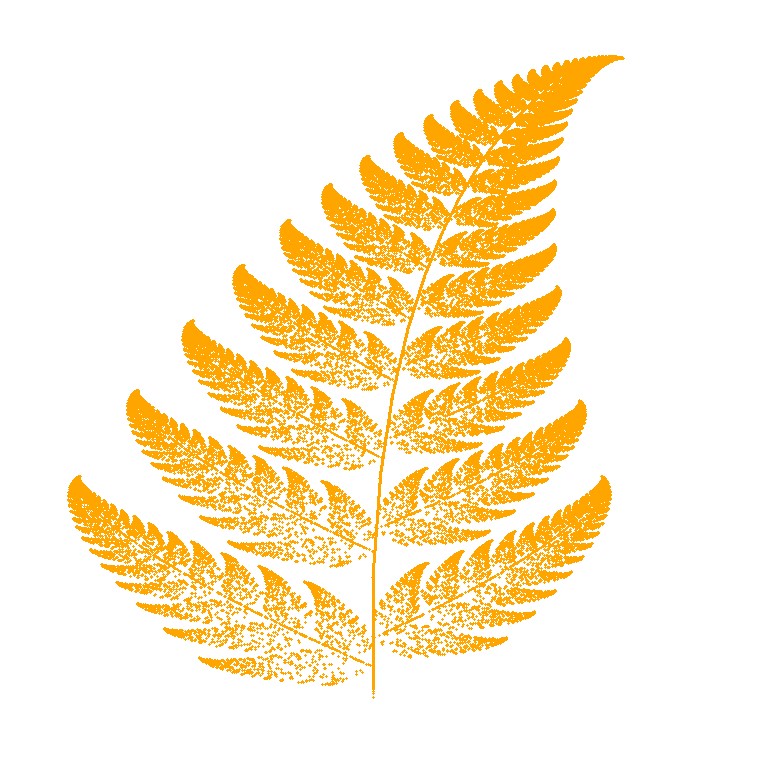 Modified Barnsley Fern - 100K iterations
Culcita Fern
This Culcita fern is featured in the somewhat stretched preview image for this post. While it looks good in green, I prefer it in the orange yellow of the preview image.
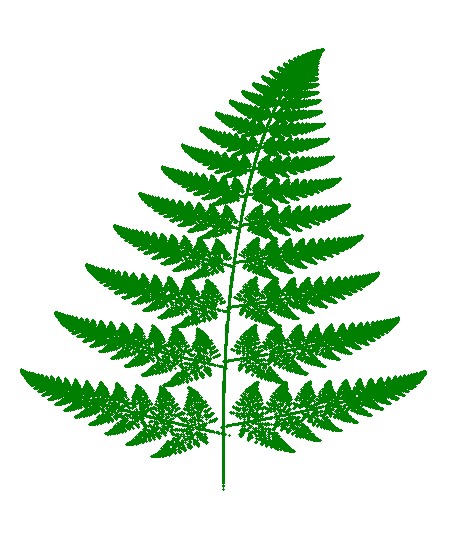 Culcita Fern - 100K iterations
Cyclosorus Fern
I don’t believe that this is the best quality Cyclosorus fern plot. I think increasing the number of iterations as well as tweaking the scale factor could go a long way towards improving the quality of the plot. Having said that, it’s not a bad attempt for something plotted using Turtle.
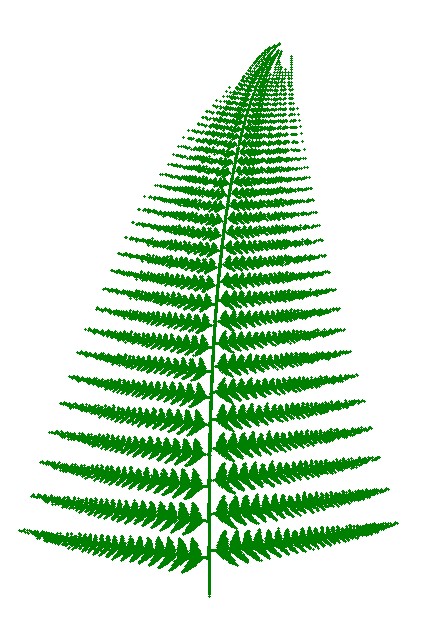 Cyclosorus Fern - 100K iterations
Closing Thoughts
While not perfect, I was relatively happy with the plots and the quality of the images that were produced using Turtle. I was able to learn from my previous mistake of not turning off screen updating and not hiding the turtle, in order to be able to render the images relatively quickly for a high number of maximum iterations. Maybe one day when I have time I can actually tweak the code, and make this little toy program a bit more user-friendly. But I think this will be all for now. The ferns aren’t really all that interesting to me anymore.
   |